Fault permeability calculation methods
The Fault Permeability form provides various methods to calculate fault permeability in the fault zone based on clay mixing (SGR), clay smearing (SSF) or the combination method (SGR - SSF). The provided methods are after Jolley et all. (2007) and Manzocchi et all. (2008) and consist of deterministic (based on lab-measured data) and numerical modeled 'fault clay content - permeability' relationships. Several functions are provided, which use the clay content property as calculated with the Fault Clay Content form, as input.
This method is based on laboratory-measurement of clay content and permeability of real reservoir faults taken from drill core in the Brent Province as published by Jolley et al. (2007). These authors found that their data could be described by the following function:

where:
Kf = Fault permeability (mD)
SGR = fault clay content (fraction between 0 and 1)
a = position coefficient (mD)
b = curvature coefficient (unitless)
With clay content as a fraction between 0 and 1, this function describes decreasing permeability with increasing clay content. Based on data of the Brent Province, Jolley et al. (2007) noted an additional decrease of permeability as a function of reservoir burial depth. From these observations, they defined five 'fault clay - fault permeability' relations (each with its own parameter set for 'a' and 'b'), and found that their reservoir simulations gave closer history matches if the relation chosen for the simulation run was from a similar depth range as the study reservoir. These relations are provided in the workflow:
- Three build-in functions for three different burial ranges, i.e. 2.1-4.3 km, 2.5-3.0 km. and 3.0-4.0 km. Comparing these functions (see figure below), it becomes clear that increased burial depth (and as such compaction) significantly reduces permeability. This effect becomes more apparent where clay fractions are higher.
- Two build-in functions which represent a lower and upper bound to the scenarios as found in the Brent Province. All relations which fit the data are bound by these two functions (see image below).
Higher values for 'a' result in a higher overall permeability (move the curve 'up') while higher values for 'b' result in more curvature which means a greater relative effect of clay fraction on permeability. As can be seen in the curves for the different depth ranges, increased pressure solution and granular compaction of the reservoir (with deeper burial) leads to an overall decrease in permeability.
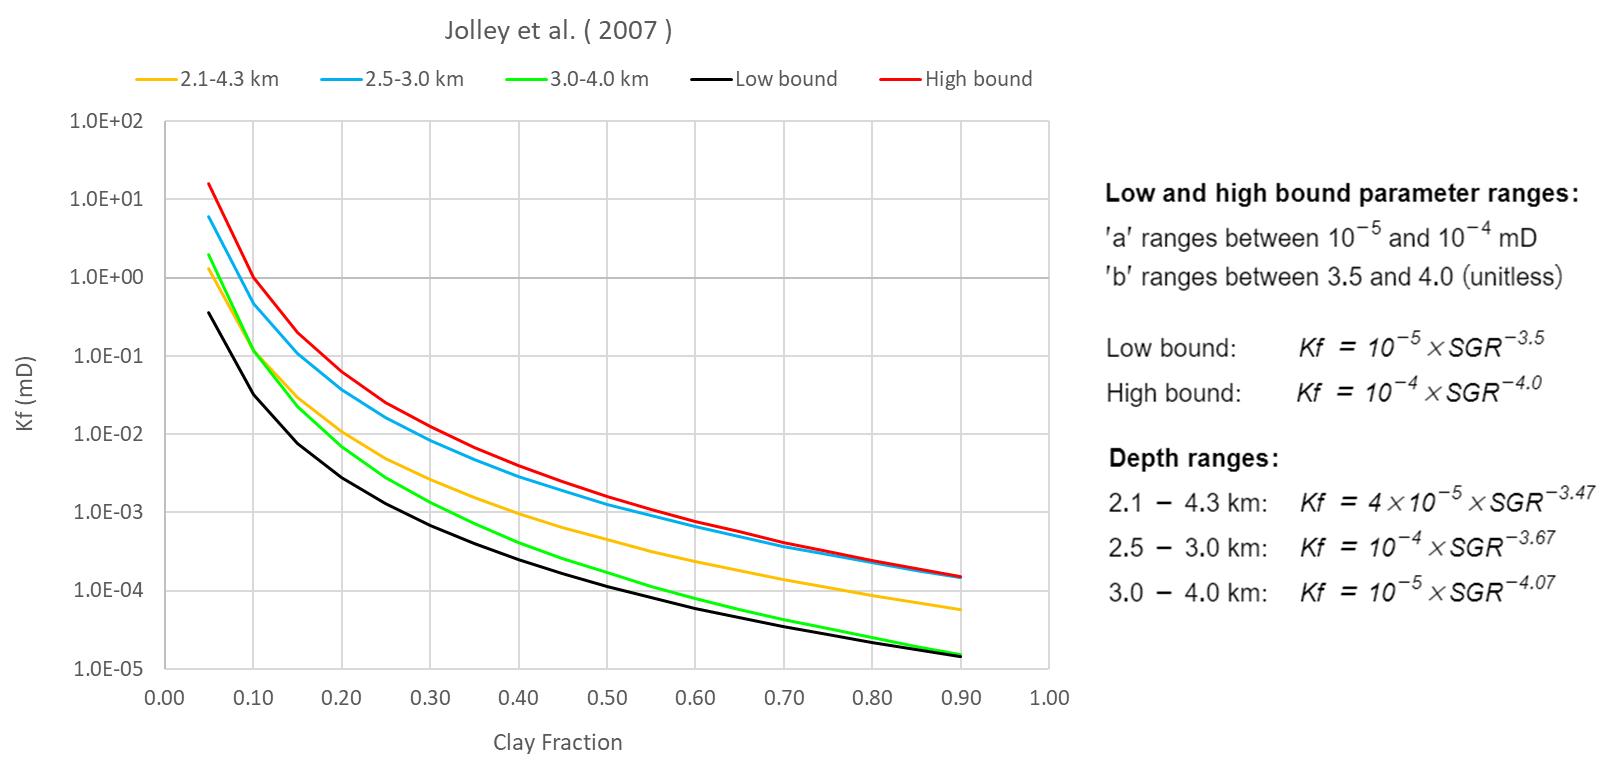
Five empirical relations after Jolley et al. (2007) and which predict permeability based on clay fraction in the fault zone are provided in the workflow. click to enlarge
On the Fault Permeability form, you can select a function associated with a particular burial depth range as base case scenario for your own reservoir, to take burial compaction into account.
Apart from selecting a build-in function you can create your own 'custom' function to emulate your own data by manually entering parameters 'a' and 'b'. To avoid non-possible scenarios, it is recommended that your custom function does not go too far outside the lower and upper bound scenarios published by Jolley et al. (2007), as these are based on real reservoir data. You can verify this on the Fault Permeability form where your function is shown against the build-in functions in the background.
The recommended ranges in your custom function for parameters 'a' and 'b' are:
- 'a' range: 0.000001 - 0.001 mD
- 'b' range: 1 - 5
See an example of the effect of varying 'a' and 'b' in these ranges in the image below:
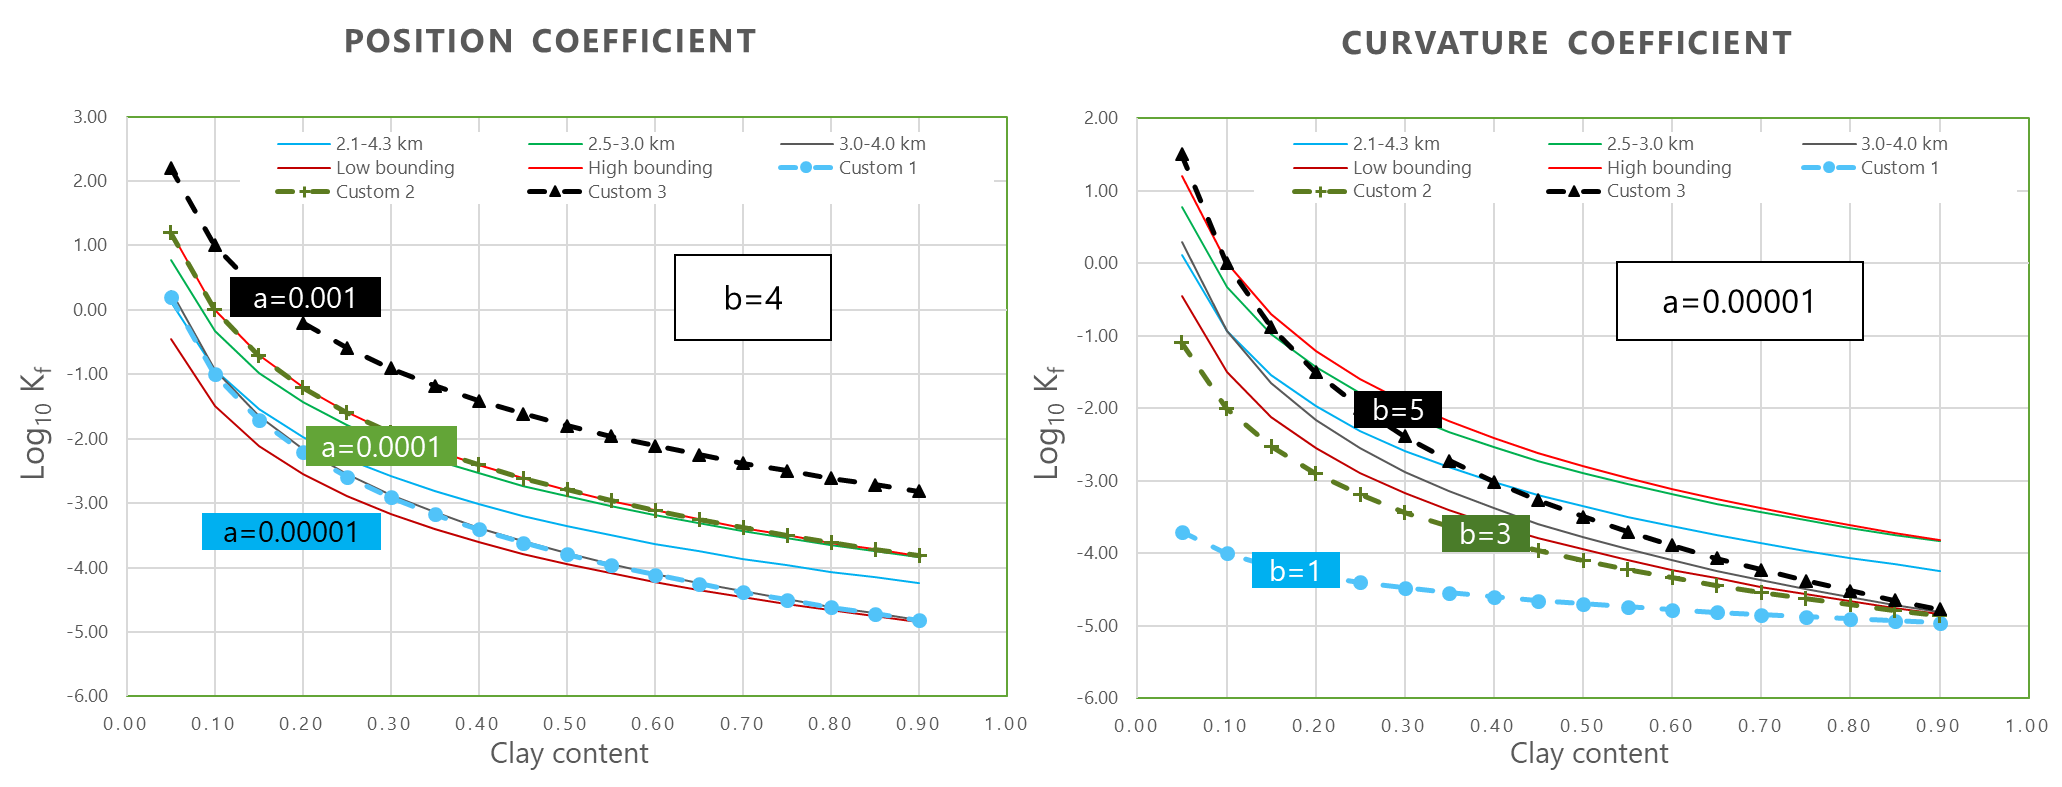
The effect on permeability with varying parameters 'a' (left image) and 'b' (right image). click to enlarge
The Fault Permeability form provides the option to set a maximum to the permeability range. As Jolley et al. (2007) demonstrate, at very low SGR values permeability can become extremely large to infinite. To avoid this artefact in the permeability result it is recommended to enter a value for maximum permeability, based on the highest permeable sands in your reservoir.
For a comparison with the functions as provided for Manzocchi et al. (2008), see the section below.
This method is based on the experimental comparison of fault property controls on the production profile of faulted reservoirs published by Manzocchi et al. (2008). Their paper characterized simulated production history profiles that result from applying different 'fault clay – fault permeability' relations from a combination of published sources, to a hypothetic shallow marine reservoir model based on the faulted Gullfaks Field. Four of their most distinctive production profile cases (and their associated 'clay content - permeability' functions) are provided on the Fault Permeability form (i.e. Case 2, Case 3, Case 4 and Case 8).
These empirical relations can be described by the following functions:

where:
Kf = Fault permeability (mD)
SGR = fault clay content (fraction between 0 and 1)
See the image below for the four production cases with a various oil rate decline (left image) and their associated empirical 'clay content - permeability' functions (right image).
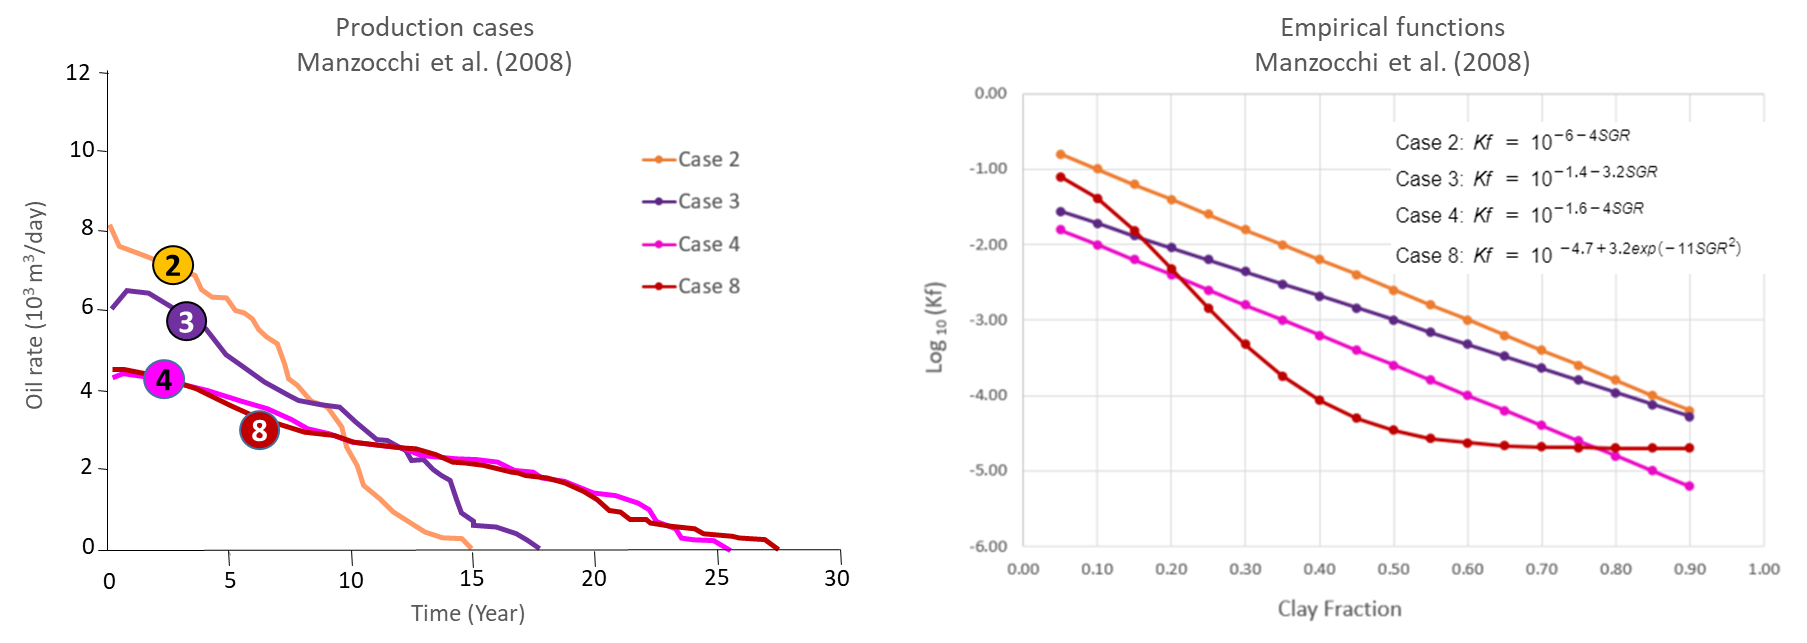
Manzocchi et al. (2008) production case history (left image) and associated empirical functions (right image) which you can select on the Fault Permeability form. click to enlarge
Fast oil rate decline as shown in Case 2 is related to the empirical function with highest permeability while slow oil rate decline is related to the empirical relations with lower permeability. The method suggested here, is to guide choice of 'fault clay - fault permeability' relation, by comparing your production history profile with the cases shown by Manzocchi et al. (2008).
Comparing Manzocchi et al. (2008) and Jolley et al. (2007)
The image below shows the combined empirical functions for 'clay content - permeability' relations after Jolley et al. (2007) and Manzocchi et al. (2008). The Jolley et al. relations show a decrease in permeability as a function of burial depth, and a power-law increase of fault permeability to values equivalent to the background permeability of the reservoir sand at low SGR values. Their data was collected from reservoirs that had a simple burial history (early fault movement followed by burial). Manzocchi et al. use data that has been amalgamated from literature sources. Their relations are generally more permeable in the mid-higher SGR range, and have 1-2 orders lower permeability in the low SGR end of the plot. That is designed to take account of permeability reducing cataclasis and cementation that develop preferentially in clean sands during late deep (post burial) fault movement. This effect can also be emulated in the Jolley et al. method by customizing ‘a’ and ‘b’ settings.
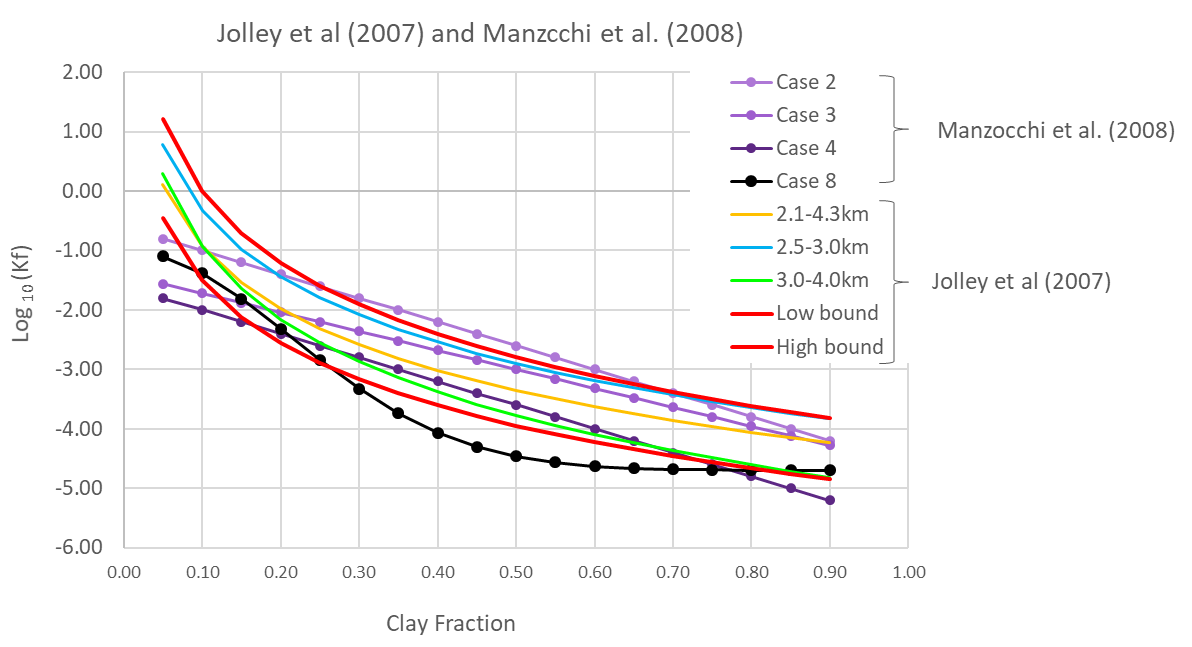
Combined plot of the empirical relations between clay content and permeability after Jolley et al. (2007) and Manzocchi et al. (2008). click to enlarge
Methods after:
Jolley, S.J., Dijk, H., Lamens, J.H., Fisher, Q.J., Manzocchi, T., Eikmans, H. and Huang, Y. 2007. Faulting and fault sealing in production simulation models: Brent Province, northern North Sea. Petroleum Geoscience, 13, 321-340. https://doi.org/10.1144/1354-079306-733.
Manzocchi, T., Matthews, J.D., Strand, J.A., Carter, J.N., Skorstad, A., Howell, J.A., Stephen, K.D. and Walsh, J.J. 2008. A study of the structural controls of oil recovery from shallow-marine reservoirs. Petroleum Geoscience, 14, 55-70. https://doi.org/10.1144/1354-079307-786.